

 Instruction Finder — Plugin for Cheat Engine
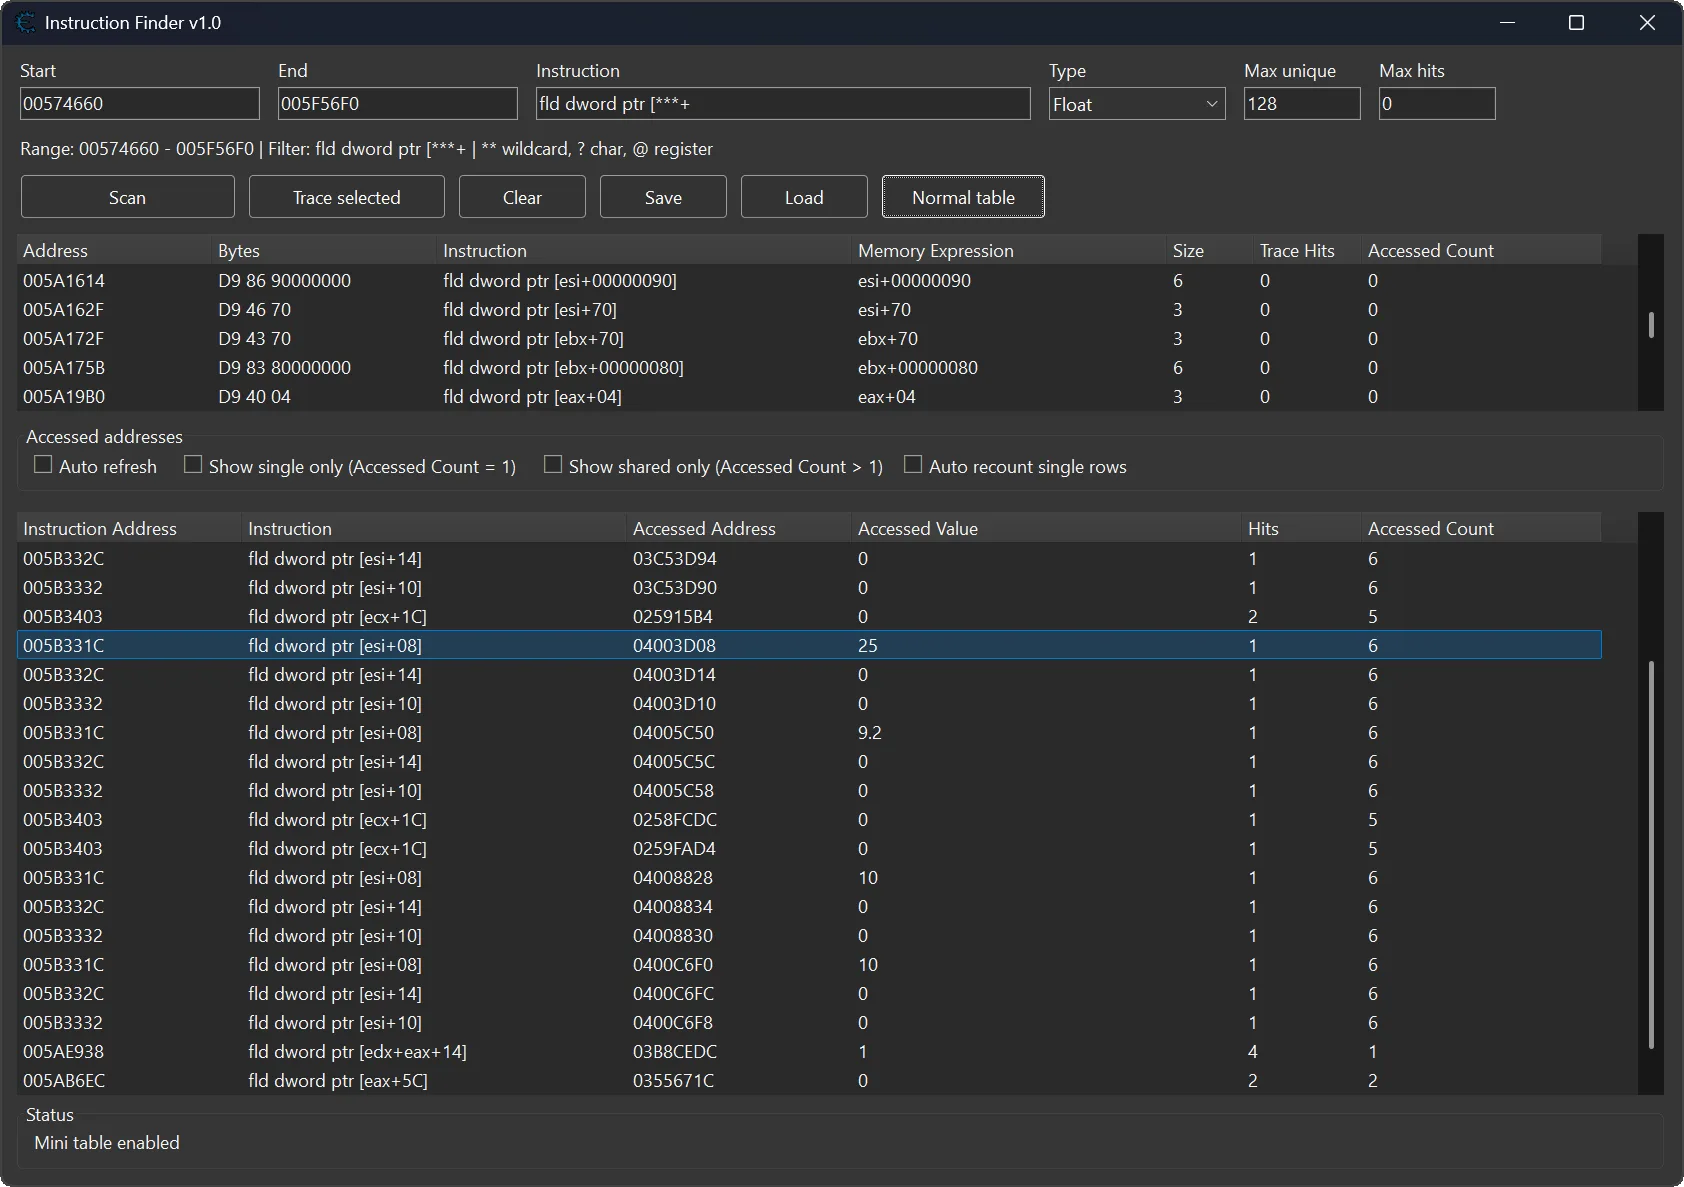
Instruction Finder is a Lua plugin for Cheat Engine that helps you search the Memory Viewer → Disassembler for matching instructions, then trace selected rows to collect accessed addresses, live values, hit counts, and unique access counts.
When debugging, reverse engineering, or creating trainers, it is often necessary to find which instructions access specific memory values. In large functions or noisy disassembly blocks, manually checking each instruction can take a lot of time.
This plugin makes the process easier by letting you scan a custom disassembly range, use wildcard-based instruction filters, select interesting instruction rows, and trace them directly from the result table.
It is especially useful when you need to quickly identify which instructions access which addresses during gameplay or runtime behavior.
 Plugin Information
- Version: 1.0
- Author: mul0
- Website: https://mul0.com/cheat-engine/plugins/c ... on-finder/
- Platform: Cheat Engine Lua plugin
- Main Menu: Memory Viewer → Search → Instruction Finder
- Hotkey: Ctrl+Shift+E
 Plugin Features
 Custom Disassembly Range Scan — Scan only the selected start/end address range.
- Wildcard Instruction Search — Search instructions using *, **, ?, and @ tokens.
- Instruction Presets — Quickly choose common scan patterns from the instruction field right-click menu.
- Trace Selected Instructions — Trace one or more selected instruction rows with execute breakpoints.
- Accessed Address Collection — Collect memory addresses accessed by traced instructions.
- Live Value Display — View accessed values as bytes, integers, floats, doubles, or array of bytes.
- Hit and Unique Counts — Track how many times an instruction is hit and how many unique addresses it accesses.
- Access Filters — Filter stack-offset rows, single-access rows, shared-access rows, and duplicate accessed addresses.
- Auto Refresh — Refresh accessed values in small batches.
- Save and Load Results — Export and restore instruction/access tables as TSV files.
 Custom Disassembly Range Scan — Scan only the selected start/end address range.
 Search Syntax
- * or ** — Matches any text fragment.
- ? — Matches one unknown character.
- @ — Matches any general register except stack/base/instruction pointer registers such as esp, ebp, eip, rsp, rbp, and rip.
Examples:
mov al,[e**
Can match instructions such as mov al,[esi+000005A5] or mov al,[eax+10].
mov al,[@
Can match memory reads through different registers.
movss xmm?,[e**+00
Can match movss instructions with unknown XMM register numbers.
 Built-In Instruction Presets
fld dword ptr [e+00
fstp dword ptr [e**+00
movss xmm?,[e+00
movss [e**+00*],xmm?
mov e**,[e+0
mov [***+0
cmp [e+
cmp byte ptr [e**+
test e,e
 How It Works
Open Cheat Engine and attach it to the target process.
Open the Memory Viewer.
Open Search → Instruction Finder or press Ctrl+Shift+E.
Set the start/end address range and enter an instruction filter.
Click Scan to find matching disassembly instructions.
Select one or more instruction rows that contain bracketed memory expressions.
Click Trace selected.
Run or trigger the target code so the breakpoints can collect accessed addresses.
Review the accessed addresses, live values, hit counts, and unique counts in the access table.
 Hotkeys and Shortcuts
- Ctrl+Shift+E — Open Instruction Finder from the active Memory Viewer.
- Ctrl+A — Select all rows in the active result table.
- Ctrl+C — Copy selected rows from the active result table.
- Delete — Delete selected rows from the instruction table.
- Double-click instruction row — Jump to that instruction in the disassembler.
- Double-click access row — Jump to the instruction address.
- Shift + double-click access row — Jump to the accessed address in the hexadecimal view.
 Save / Load Support
- Save instruction and access results as TSV files.
- Saved files include plugin version, save time, value type, scan range, instruction filter, found instructions, and accessed addresses.
- Load saved TSV files later to continue reviewing previous scan and trace results.
 Installation
- Download "MiMemory Viewer - Instruction Finder.lua".
- Place the file inside the Cheat Engine autorun folder:
Cheat Engine\autorun\ - Start or restart Cheat Engine.
- Open Memory Viewer.
- Select Search → Instruction Finder or press Ctrl+Shift+E.
 Important Notes
- Tracing uses Cheat Engine's debugger breakpoint API.
- Only instruction rows with bracketed memory expressions can be traced.
- The target code must run while tracing so the plugin can collect real accessed addresses.
- Large scan ranges can take longer, so it is better to start with a focused range around the code you are researching.
- Use Max unique and Max hits to control when tracing should stop.
 Feedback & Support
- Have suggestions, bug reports, or ideas for improvement? Leave a comment on the blog — feedback is always welcome!

