

 Callsite Monitor v1.3 — Plugin for Cheat Engine
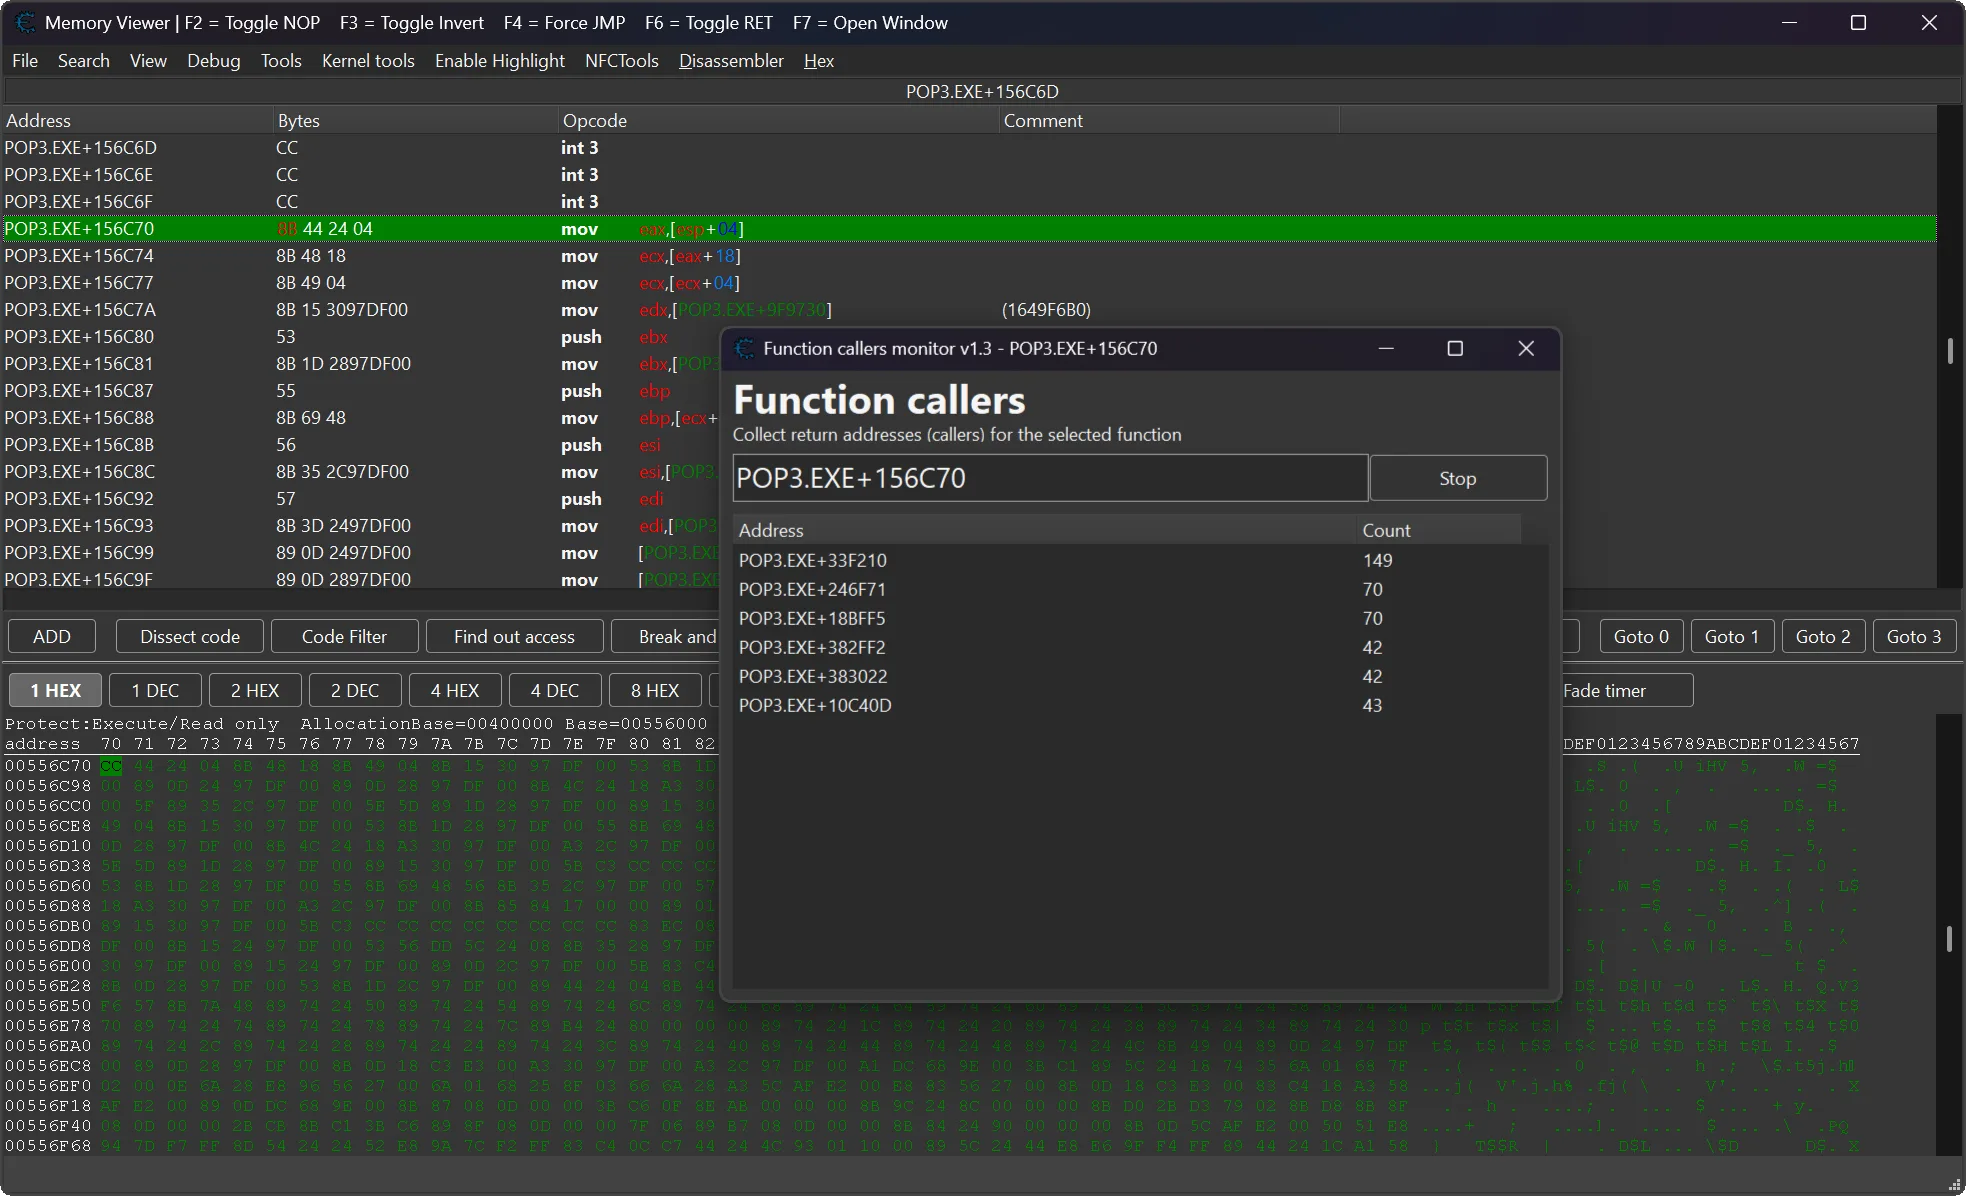
Callsite Monitor is a lightweight Lua plugin for Cheat Engine designed to analyze how a function is being called at runtime.
It tracks and counts return addresses, also known as call sites, that invoke a selected function. This gives you a clear view of execution flow, caller frequency, and hot paths while debugging or reverse engineering.
When analyzing a function, it is often important to know where that function is being called from. Manually checking every possible caller can be slow and unreliable, especially in large code sections.
This plugin solves that problem by placing a breakpoint on the selected function and collecting caller addresses automatically. It helps reverse engineers, researchers, and trainer makers quickly understand which code paths are reaching a function.
 Plugin Information
- Version: 1.3
- Author: Skyrimfus (original) + improvements by mul0
- Website: https://mul0.com/cheat-engine/plugins/c ... oncallers/
- Platform: Cheat Engine Lua plugin
- Hotkey: Ctrl + Alt + F
 What's New in v1.3
- 🗔 Multi-Window Support — Open independent monitor windows for different functions at the same time.
 Smart Window Reuse — Reuses and focuses an existing monitor window when tracking the same function address again.
 Improved Memory Management — Forms are automatically freed on close to prevent memory leaks.
 Cleaner Formatting — Centralized symbol/hex address formatting and improved column auto-resizing code.
 Plugin Features
 Function Call Tracking — Sets a breakpoint on a selected function and tracks who calls it.
- Return Address Capture — Reads the return address from the stack on each function entry.
- Caller Counting — Counts how many times each callsite invokes the selected function.
- Live Caller Statistics — Displays caller addresses and invocation counts in real time.
- Multi-Window Support — Monitor multiple functions at the same time.
- x86 and x64 Support — Works with both 32-bit and 64-bit processes.
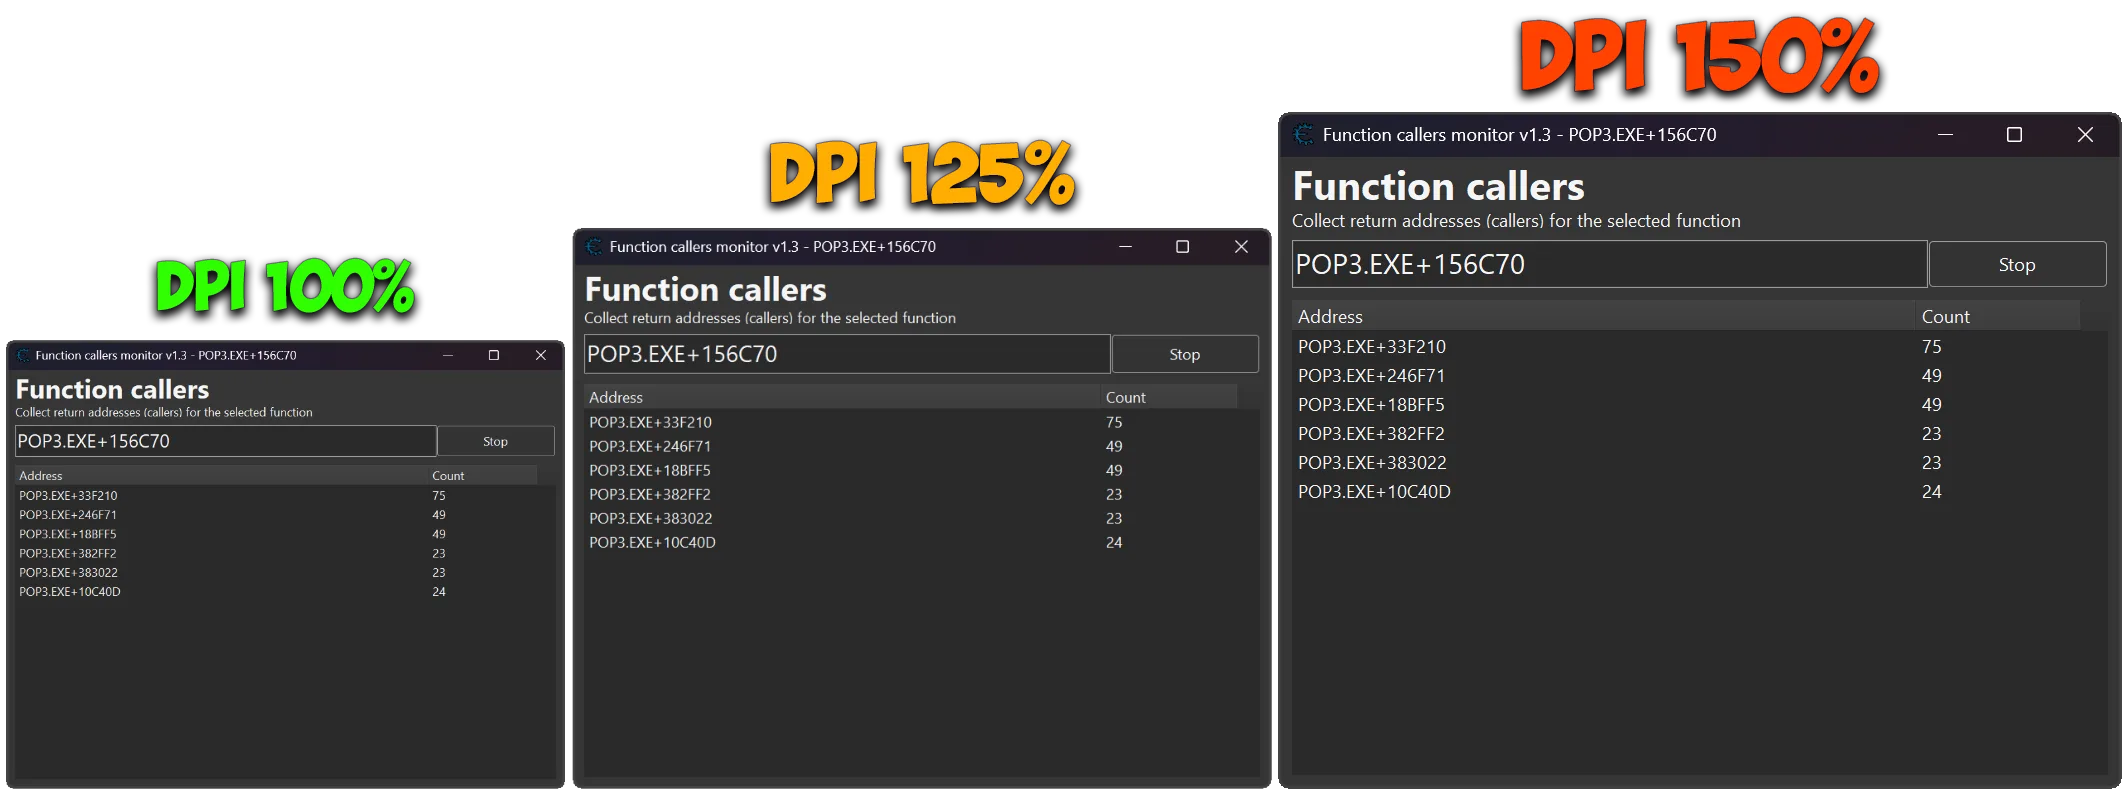
- DPI-Aware Interface — Clean, resizable UI with improved scaling.
- Memory Viewer Integration — Works directly from the Cheat Engine disassembler.
- Clipboard Support — Copy selected caller entries for later analysis.
 Function Call Tracking — Sets a breakpoint on a selected function and tracks who calls it.
 How It Works
Select a function or instruction address in the Cheat Engine Memory Viewer.
Press Ctrl + Alt + F.
The plugin opens a Callsite Monitor window for the selected address.
A breakpoint is placed at the target function entry.
On each hit, the plugin reads the return address from the stack.
Return addresses are grouped and counted.
Results are displayed live without requiring manual caller inspection.
 Live Caller Statistics
Shows a real-time list of caller addresses.
Each entry displays the caller address or symbol name when available.
Each caller has an invocation count.
The list updates efficiently only when values change.
Double-clicking a caller jumps directly to it in the Memory Viewer.
🖥 Interactive Monitor Window
Clean and resizable interface.
Independent tracking windows for different function addresses.
Smart reuse prevents duplicate windows for the same target address.
Column auto-resizing keeps caller addresses and counts readable.
Multi-select support is available in the callers list.
 Shortcuts & Integration
- Ctrl + Alt + F — Start monitoring the selected Memory Viewer address.
- Double-click caller row — Jump to that caller address in Memory Viewer.
- Copy selected entries — Copy caller address and count to clipboard.
- Shift-click support — Quickly use the currently selected disassembler address.
🖥 Example Use Cases
Find which code paths call a selected function.
Identify the most frequent callers of a function.
Track hot paths during gameplay or runtime behavior.
Analyze execution flow without manually checking every CALL instruction.
Compare caller frequency while testing different actions in a game or application.
Speed up reverse engineering and trainer development workflows.
 Compatibility
- Cheat Engine Lua plugin
- Supports x86 and x64 processes
- Works directly with the Memory Viewer
- Supports multiple monitor windows
- Designed for debugging, reverse engineering, profiling, and behavior analysis
 Installation
- Download "MiMemory Viewer - FunctionCallers.lua".
- Place the file inside the Cheat Engine autorun folder:
Cheat Engine\autorun\ - Start or restart Cheat Engine.
- Open Memory Viewer.
- Select an instruction or function address.
- Press Ctrl + Alt + F to start monitoring callers.
 Important Notes
- The plugin uses Cheat Engine breakpoints to monitor function entries.
- The tracked function must be executed for caller addresses to appear.
- Return addresses are read from the stack using the correct x86/x64 stack pointer.
- Multi-window mode allows tracking different functions independently.
- If the same function is selected again, the existing monitor window is reused and focused.
 Feedback & Support
- Have suggestions, bug reports, or ideas for improvement? Leave a comment on the blog — feedback is always welcome!

